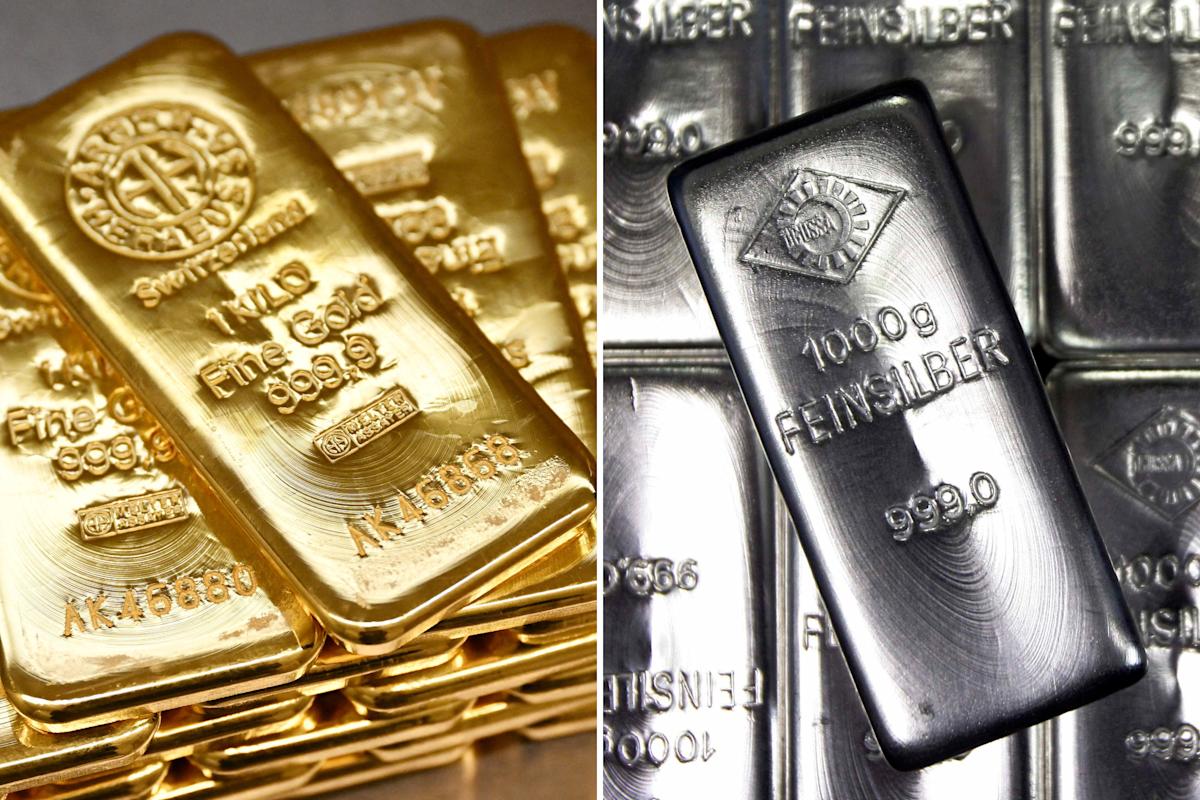

Gold Reached a Record $5,594 Per Ounce – Then Lost 10% in Hours
Spot gold – the market price for one ounce of gold in US dollars – was trading at $2,660 roughly a year ago. By late January 2026, it had reached $5,594.80 per ounce, a gain of more than 63 per cent in twelve months. The speed of the final leg was remarkable even by recent standards. On 26 January alone, the price broke through both $5,000 and $5,100 in the same trading session. Two days later it cleared $5,200, $5,300, and $5,400 – all within hours of each other.
Then the reversal came just as fast. By the end of the following week, gold had slipped back below $5,000, which means more than 10 per cent of its value vanished in a matter of days. On Monday of the first full week of February, the price dropped as low as $4,660 before bouncing back toward the $5,000 level, where it has since settled into a narrow range.
That kind of volatility in an asset that people call a “safe haven” tells you something important about what is actually driving the gold market right now.
Five Forces Behind Gold’s 63% Rally in One Year
No single factor explains a move of this size, but five forces working at the same time account for most of what happened.
The first and most fundamental is the weakening US dollar. A year ago, one euro bought $1.02 – and serious analysts were discussing euro-dollar parity. That exchange rate now sits around $1.18, and it briefly touched $1.20 in late January for the first time since mid-2021. Because gold is priced in dollars, a weaker dollar pushes the nominal gold price higher even when real demand stays flat. It also makes gold cheaper for buyers holding euros, pounds, or yen, which increases international demand.
The second force is the explosion of retail investors trading through apps. Individually, each retail trade is small. Collectively, these trades now represent a significant share of market volume, and because many retail investors follow momentum or social media trends rather than fundamentals, they amplify price swings in both directions.
The third factor is portfolio rotation away from US technology stocks. Large institutional investors spent much of the past two years concentrated in a handful of big tech names that many analysts now consider overvalued. Diversifying into gold is a classic hedge against that kind of risk.
The fourth is falling interest rates across most major economies. When rates drop, assets that pay no yield – like gold – become relatively more attractive compared to bonds and savings accounts.
The fifth and most powerful driver is political uncertainty generated by the Trump administration. Every major spike in the gold price over the past year lines up directly with a specific policy event from Washington.
Table: Gold Price Spikes and Their Triggers in 2025–2026
| Date | Gold Price Move | Trigger Event |
| April 2025 | Sharp spike | Trump’s Liberation Day tariffs announcement |
| September 2025 | Sharp spike | Attempt to fire Fed board member Lisa Cook; weak US economic data |
| Late January 2026 | Surge to $5,594 | Venezuela military action, Greenland threats, Iran rhetoric, European tariff threats, DOJ criminal probe into Fed Chair Jerome Powell |
| Early February 2026 | Drop to $4,660 | Trump nominated Kevin Warsh as next Fed Chair – seen as hawkish and independent |
The pattern is consistent. When Trump escalates geopolitical conflict or threatens the independence of the Federal Reserve, gold surges. When a signal arrives that institutional stability might hold – such as the Warsh nomination – gold pulls back.
The Federal Reserve Factor: Why It Matters More Than Tariffs
The single most important thread running through the gold rally is not tariffs or foreign policy – it is the question of whether the US Federal Reserve can operate without political interference. Trump has repeatedly pushed for faster and deeper interest rate cuts. The DOJ investigation into Fed Chair Jerome Powell and the earlier attempt to remove Lisa Cook from the board are seen by markets as direct attempts to bring the central bank under presidential control.
This matters to gold for a specific reason. Central banks around the world hold US Treasury bonds and dollars as core reserve assets because they trust that the Federal Reserve operates on economic data rather than political pressure. If that trust breaks, those institutions start moving reserves elsewhere. Gold is the primary alternative, and data from the World Gold Council shows that central bank gold purchases have been running at historic highs for three consecutive years.
The Warsh nomination calmed markets precisely because he has a track record of hawkish positions on interest rates, which suggests he would resist pressure from the White House to cut rates purely for political reasons. That reassurance pulled gold back from its highs – but the underlying concern about Fed independence has not disappeared.
Where the Gold Actually Sits: Fort Knox, New York, and Other People’s Vaults
Around one quarter of all gold ever mined is held in national reserves, according to the World Gold Council. The United States holds the largest stockpile at over 8.1 metric tonnes, with more than half stored at Fort Knox in Kentucky – a military vault built in the 1930s to move gold away from coastal cities considered vulnerable to invasion.
Many countries store their gold overseas rather than at home. Ireland’s Central Bank holds approximately 12 tonnes of gold deposited with the Bank of England and the French Central Bank. Even Germany, which holds the world’s second-largest gold reserve, keeps a significant portion in the United States – a decision that has drawn growing criticism from German economists who argue that Trump’s hostility toward European allies should prompt immediate repatriation.
Table: Largest National Gold Reserves (World Gold Council Data)
| Country | Gold Reserve | Notable Detail |
| United States | 8,133 tonnes | Largest in world; majority at Fort Knox and NY Fed |
| Germany | 3,352 tonnes | Second largest; portion held in US vaults |
| Italy | 2,452 tonnes | Third largest; exceeds China’s declared holdings |
| France | 2,437 tonnes | Held domestically by Banque de France |
| China | ~2,264 tonnes (declared) | Unofficial estimates suggest up to double this figure |
| Ireland | ~12 tonnes | Held at Bank of England and Banque de France |
The Fort Knox conspiracy – the theory that the vault does not actually contain as much gold as claimed – gained mainstream traction when Trump himself said his administration would verify the facility’s contents, following a post from Elon Musk. Treasury Secretary Scott Bessent responded that the gold was accounted for, but Fort Knox has not been publicly audited since the 1970s, which keeps the question alive regardless of official assurances.
What Gold’s Volatility Actually Tells You About 2026
Gold at $5,000 per ounce does not mean the global economy is collapsing. It means a specific set of investors – central banks, institutions, and retail traders alike – are pricing in uncertainty about the stability of the US dollar, the independence of the Federal Reserve, and the predictability of American trade and foreign policy. The moment any of those concerns eases, gold pulls back sharply, as the Warsh nomination demonstrated within hours.
That is the core reality of gold in 2026: it is less a safe haven and more a live barometer of how much the world trusts the United States to behave like a predictable economic partner. When that trust dips, gold rises. When it recovers, gold falls. The metal itself has not changed. The question is whether the conditions that pushed it to record highs are temporary disruptions or a structural shift in how global markets assess American risk.